TestDriven.Net - Quickstart
Introduction
This section provides a 'Quickstart' guide to using TestDriven.Net
on Visual Studio 2013, 2012, 2010, 2008, 2005 or 2003.
Test Driven Development is the practice of writing unit tests for your code before you actually write that code. By writing a test and then writing the code to make that test pass you have a much better idea of what the goal and purpose of your code is. Test Driven Development not only increases the quality of your code, but also allows you to refactor the internals of a method or class and quickly and easily test the outside interface of the object.
TestDriven.Net is a unit testing add-in for Visual Studio. It supports multiple unit testing frameworks including NUnit, MbUnit,
xUnit and MSTest.
Installing
TestDriven.Net can be installed using an administrator or limited user account. Because limited users don't have write access to the 'Program Files' folder, a limited user installation will install files in user's 'Application Data\TestDriven.Net' folder. An administrator installation will install files in the 'Program Files\TestDriven.Net' folder. These defaults can be changed by selecting 'Custom' on the 'Choose Setup Type' page.
TestDriven.Net is packaged with several versions of the NUnit unit testing framework.
It also includes an adaptor for executing Visual Studio Team System unit tests
when available.
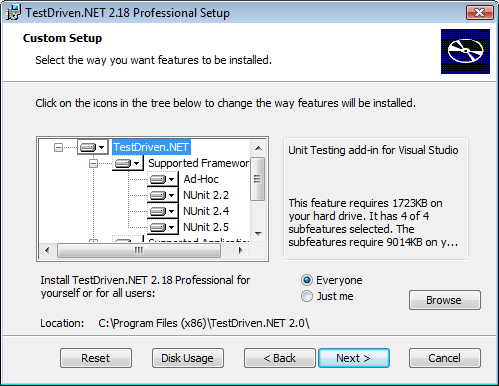
Figure 1. TestDriven.Net Setup
Run Test(s)
After installing TestDriven.Net and re-starting Visual Studio, the 'Run Test(s)' command (available on the Right-Click context menu) offers a straightforward way to build and run tests. It is intended to be the default method of test execution in most contexts. It automatically detects the test framework being used and executes tests using the correct test runner. The tests are launched by a test execution engine running as an external process. This test process is kept alive in order to improve execution times on subsequent runs. Once a test process has been cached, a rocket icon will appear in the notify box.
If the code editor window is selected, the test(s) to execute will be determined by the position of the caret; individual tests are executed by right-clicking anywhere inside a test method and selecting 'Run Test(s)' as shown in Figure 2; all tests in a test fixture are executed by right-clicking inside a class (but outside of any method) and selecting 'Run Test(s)'; all tests in a namespace are executed by right-clicking inside a namespace and selecting 'Run Test(s)'.
The 'Run Test(s)' button is also found on various 'Solution Explorer' context menus. It can be used to execute all tests in a solution, project or project item.
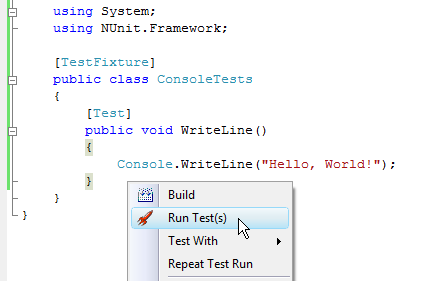
Figure 2. Run Test(s) menu item
Ad Hoc Tests
Ad hoc tests offer a useful alternative to throw away console applications. They should not in any way act as a substitute for real unit tests. Rather, they are intended to provide a convenient way of exploring local private methods or 3rd party
libraries.
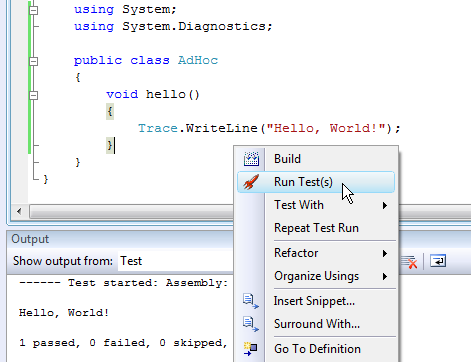
Any method can be executed as an ad-hoc test simply by right-clicking inside it and selecting 'Run test(s)'
or 'Test With > Debugger'. It can be a 'public', 'private', 'static' or 'instance' method. In the case of an 'instance' method, an object will be created using the default constructor of the class (providing, of course, that the class has a default constructor). The 'Dispose' method will be called on any object that implements 'IDisposable', once the test has been executed.
If an ad hoc test returns an argument, the argument will be expanded to the 'Test' output pane. Complex objects will have their fields and properties displayed. Enumerable objects will be listed. Primitive objects will be converted to strings and displayed. The same result can be obtained by using 'Trace.WriteLine(ob, "_verbose")'.
Test Output & Error List
The 'Test' output pane is the window in which all test results and warning messages appear and is shown in Figure 3 (below). Trace and debug information is also sent there, along with console output and error messages. If all tests in a project or solution are being executed, the test output pane will only display ignored or failed tests
and console output.
When a test fails, the name of the test together with the exception message and stack trace is displayed. If code has been compiled with debugging information, the corresponding portions of the stack trace will contain line numbers. Double-clicking on these portions is a convenient way of navigating to the offending code.
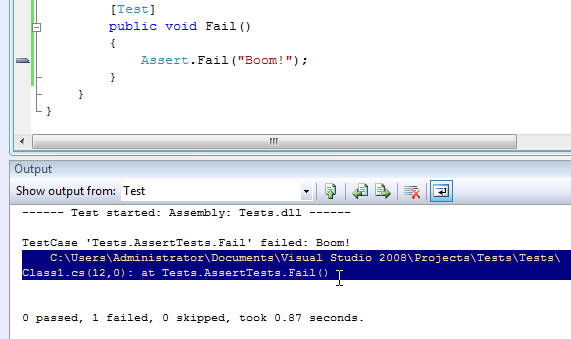
Figure 3. Output Test Pane
As well as sending information to the output pane, failing tests also get added to the
Error List. If many tests have failed, this creates a useful summary view as shown in Figure 4 (below). Generally, the further up the stack trace, the more likely the code will be of interest. Double-clicking on a test in the task list is an alternative way of accessing the code in question.
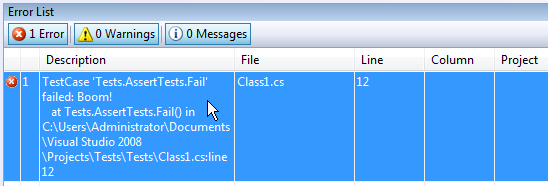
Figure 4. Error List view
Test With > Debugger
The 'Test With' menu offers many alternative contexts in which to run tests
(depending on which applications are installed). Selecting the 'Debugger' context executes test(s) with the Visual Studio debugger attached as shown in Figure 5 (below). By setting a breakpoint on a method and selecting 'Test With Debugger' it is possible to step into a unit test.
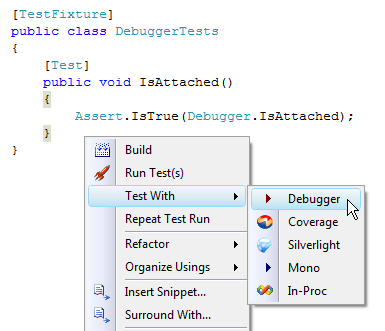
Figure 5. Test With Debugger
Test Projects & Solutions
By right-clicking on a project in the 'Solution Explorer' window and selecting 'Run Test(s)', all tests within that project will be executed. Failed and ignored tests are sent to the 'Test' output pane and task list in a similar fashion to other 'Run Test(s)' commands.
By default, trace and debug output is suppressed when executing all tests in a project or solution.
Similarly, all tests in a solution can be executed by right-clicking on the solution in the 'Solution Explorer' window and selecting 'Run Test(s)'. For each project in the solution the test framework being used is established and tests are executed using the correct test runner. Projects that do not contain any tests are ignored.
Aborting a Test Run
When a test run is in progress an 'Abort Test' menu item will appear on the 'Tools' menu as shown in Figure 6 (below). Selecting this item will abort the thread the tests are executing on. When tests are aborted in this way, any cleanup logic is given a chance to run.
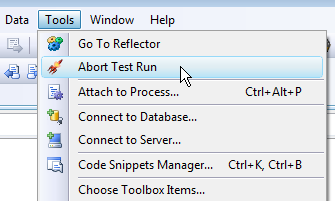
Figure 6. Abort Test
Stopping the Test Process
There are some circumstances in which it is necessary to stop the test process. The most common of these is when an app domain is created, but not unloaded by a test run. This can result in any assemblies loaded by the app domain being locked, and subsequent builds failing. It is possible to recycle the test process by right-clicking on the rocket icon in the notify box and selecting 'Stop' as shown in Figure 7. A new test process will be launched the next time the 'Run Test(s)' command is executed.
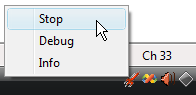
Figure 7. Stopping the Test Process